At my job we use Bazel as our primary build system. Bazel is great for managing large projects with millions of lines of code spanning thousands of dependencies, as it has an efficient caching system that allows for incremental compilation.
The way this works is that during build time, Bazel generates a dependency graph to represent the relationship between different libraries in your project, as well as third-party libraries. Internally, this is represented as a Merkle tree so that only actions whose hashes have changed (and their upstream dependencies) need to be re-compiled.
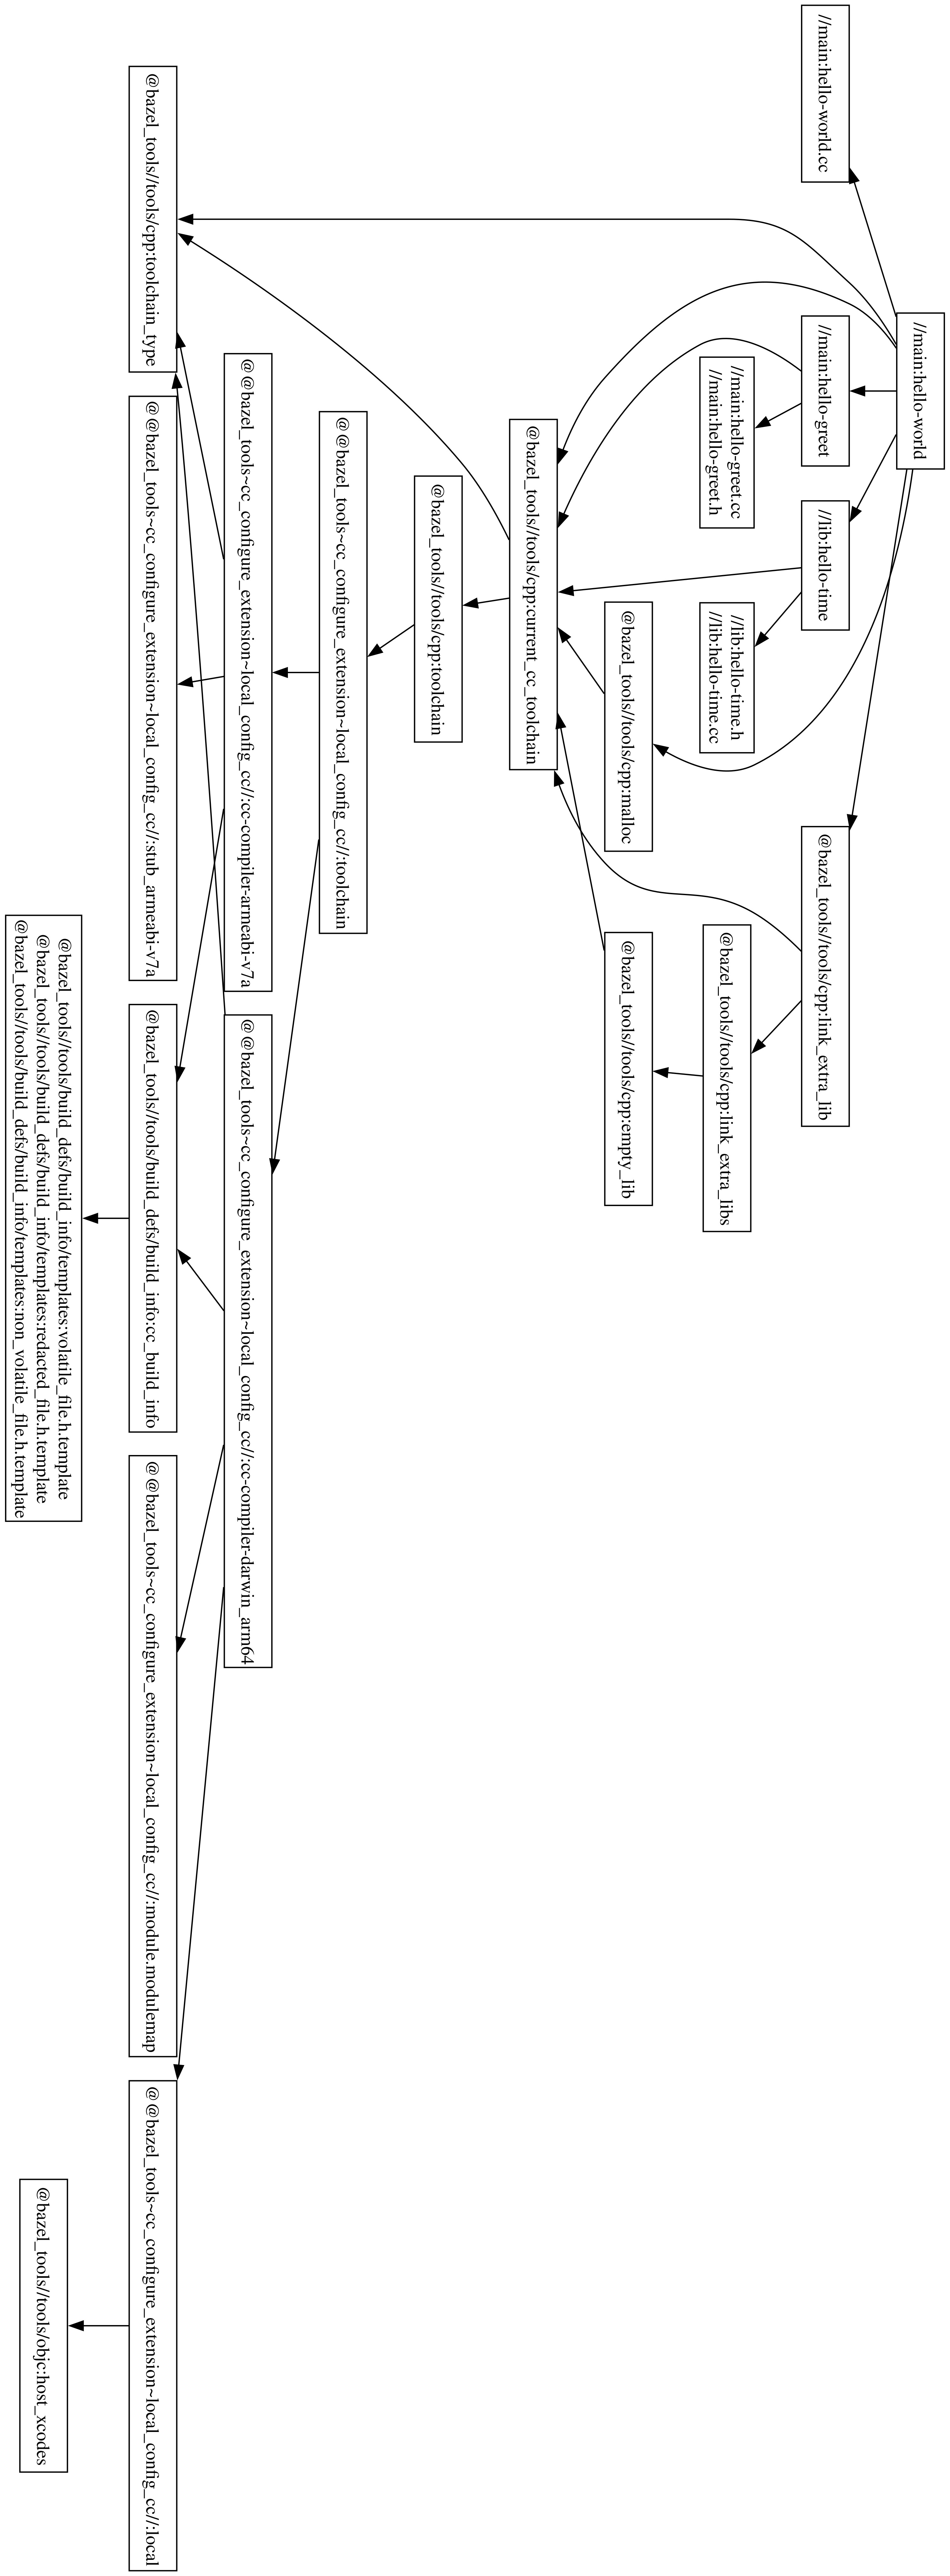
Often you will want to inspect this graph to reason about errors. For instance, we recently ran into an issue where a third-party library was throwing a link-time error, but that dependency was nowhere to be found in our resolve and we couldn’t figure out why it was being pulled in. Bazel’s provided solution for looking at your dependency graph is to use its query language, which can return the path between two dependencies. To visualise the whole tree, Bazel recommends using a query to generate the graph, then piping it to a separate tool, which generates an SVG image (I’m not kidding).
A hello-world tutorial looks like this:

Can you imagine what this would look like for any sizable project?!
To aid my own sanity, I wrote a little CLI tool called bazelvis to visualize this dependency graph. All you need to do is clone the repo and run the included build script:
git clone https://github.com/jamesma100/bazelvis
./build.sh
Then run the generated binary under ./bin/bazelvis on any target of your choice in the same directory as your Bazel workspace.
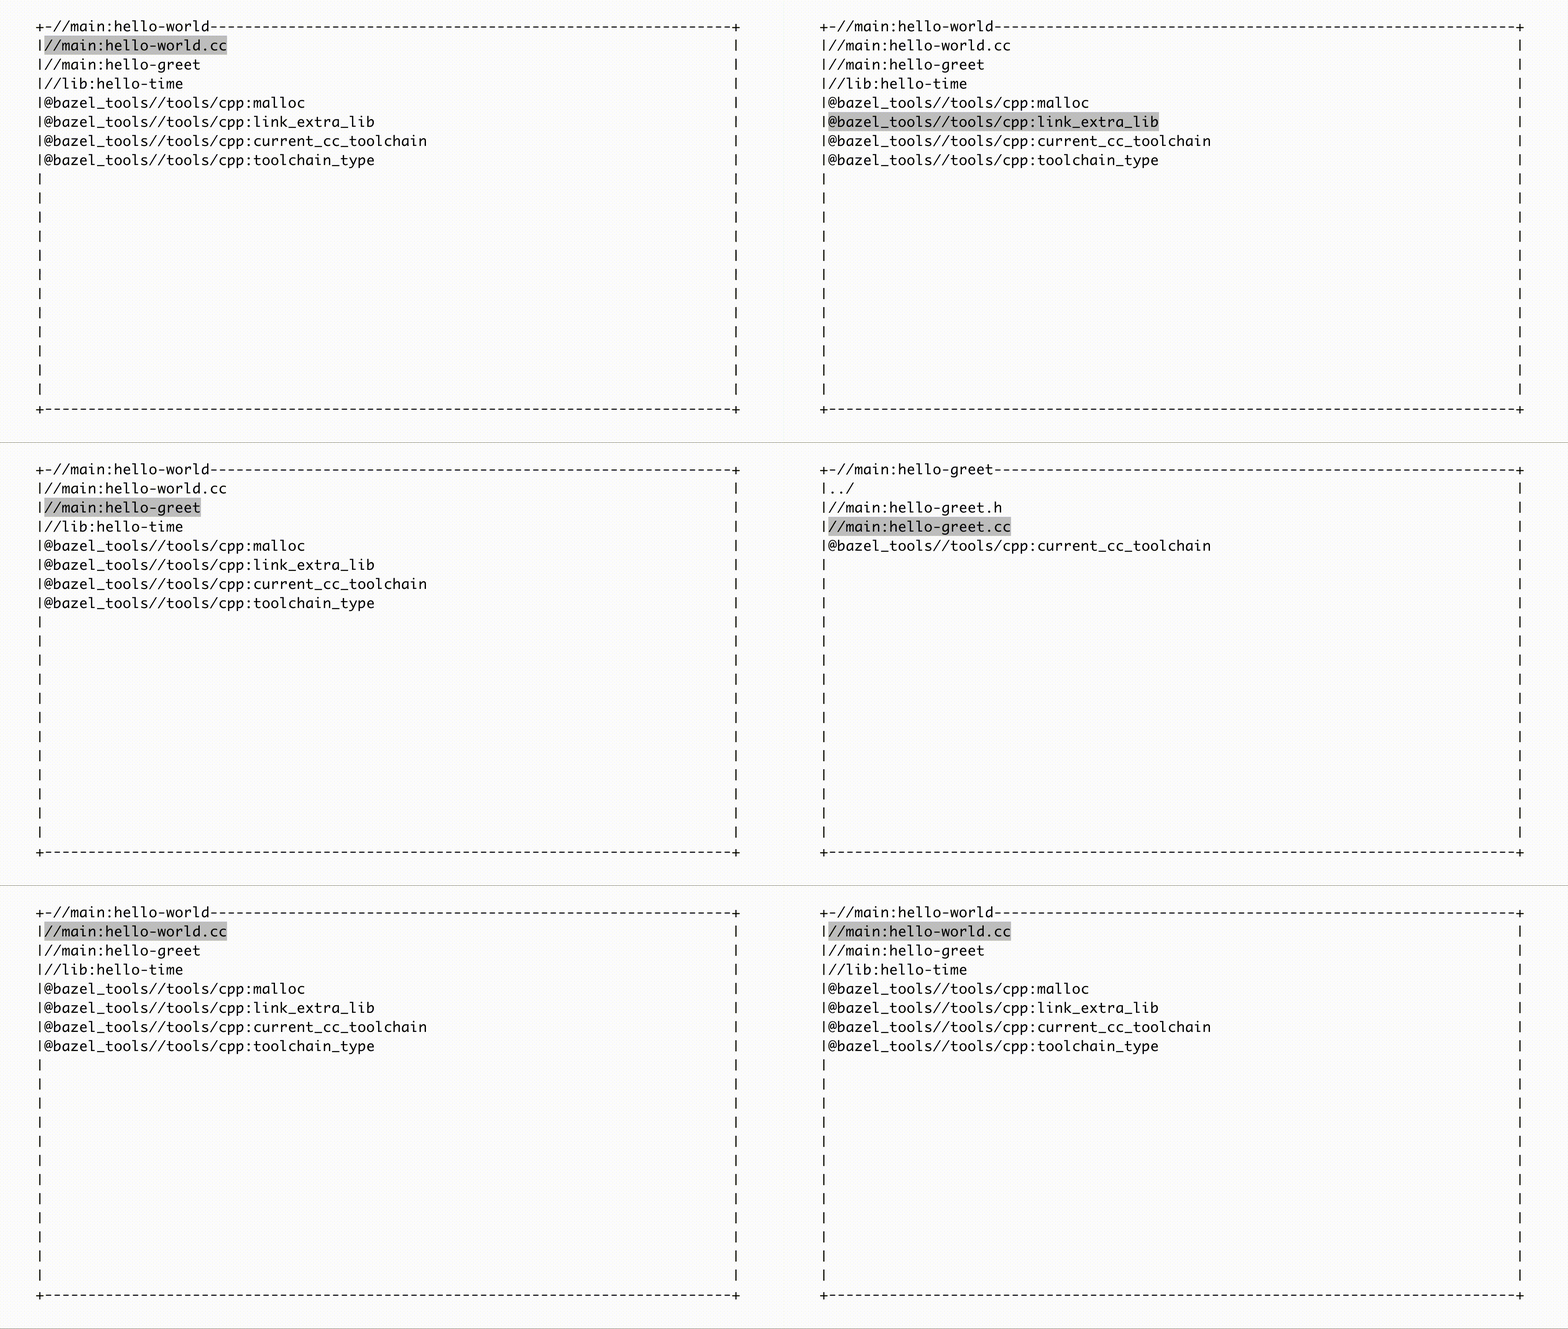
Using the same C++ tutorial example as above:
git clone https://github.com/bazelbuild/examples
cd examples/cpp-tutorial/stage3
bazelvis bazelvis main:hello-world

You can see all children of a given node by selecting it and hitting enter, which will open up a new window. You can also go back to the parent by going to ../.
If you think about it, software dependencies are exactly a directed acyclic graph, much alike a filesystem. And this is exactly how you would traverse a filesystem in Vim if you open a directory instead of a file.
Writing a simple terminal UI wasn’t as bad as I thought. Much of the heavy-lifting was handled by the opensource gocui package, but there was still a fair bit of work in parsing the tree, generating each view, and supporting scrolling up/down when there are too many dependencies to fit on the screen. The meat of the UI lies in a single Go file of ~140 lines of code.
Lastly, this is more of a personal productivity tool than a opensource project designed to work in all cases, so I don’t intend to actively maintain it. But nonetheless, feel free to open a PR if you find room for new features or bug fixes!